M Kodaira, S Shibusawa – Geoderma, 2012
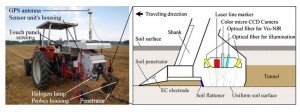
In this study, we developed twelve spectroscopic models based on visible and near-infrared (Vis–NIR: 305–1700 nm) soil reflectance spectra to predict and map at a high spatial resolution soil properties that are useful for site-specific soil management and precision agriculture. We collected using a real-time soil sensor (RTSS) with a differential global positioning system (DGPS). The investigated soil properties were moisture content (MC), soil organic matter (SOM), pH, electrical conductivity (EC), cation exchange capacity (CEC), total carbon (C-t), ammonium nitrogen (N-a), hot water extractable nitrogen (N-h), nitrate nitrogen (N-n), total nitrogen (N-t), available phosphorus (P-a), and phosphorus absorptive coefficient (PAC).
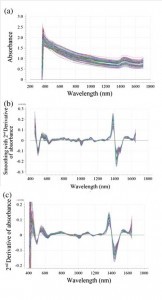
The experimental site is a commercial upland field with alluvial soil located in Hokkaido, Japan. To develop the calibration models, 144 soil spectra were collected with the Vis–NIR spectrometer in the RTSS. Partial least squares regression (PLSR) coupled with full (leave-one-out) cross-validation were used to establish the relationships between the Vis–NIR soil reflectance spectra and the soil properties, whose values were obtained by soil chemical analysis. We show the coefficient of correlation, coefficient of determination (R2), root mean square error and residual prediction deviation (RPD). The accuracy of the spectroscopic models ranged from R2 0.45 to 0.93 and RPD from 1.0 to 3.6. Our results were compared with previous studies, which include field-based and lab-based results. The accuracy of our predictions as measured by the RPD for MC, SOM, CEC, C-t, N-a, N-n, N-t, P-a, and PAC was similar or better than those obtained in previous studies. RPD results for pH, EC and N-h were only slightly poorer. In this study, we developed twelve spectroscopic models based on visible and near-infrared (Vis–NIR: 305–1700 nm) soil reflectance spectra to predict a.
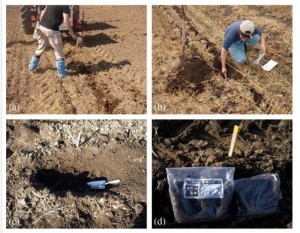
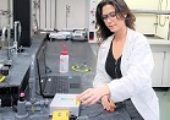
Fig. 5. Soil sampling method: (a) 72 wooden sticks were inserted in the soil at points predetermined by scanning data number, (b) uniform soil surface smoothed over by the RTSS was dug up, (c) soil samples were collected from in and around the area scanned by the RTSS, (d) soil samples were divided into two sealable plastic bags, one set to be sent to TUAT, the other set to be sent to APCRL.

