Glen L. Ritchie
We quantified the spectral reflectance characteristics of hard red spring wheat (Triticum aestivum cv. Westbred 936) in research plots subjected to either nitrogen or water stress in a two year study. Both types of stress reduced ground cover, which was evaluated by digital photography and compared with ten spectral reflectance indices. On plots with a similar soil background, simple indices such as the normalized difference vegetation index, ratio vegetation index, and difference vegetation index were equal to or superior to more complex vegetation indices for predicting ground cover. Yield was estimated by ivintegrating the normalized difference vegetation index over the growing season. The coefficient of determination (r2) between integrated normalized difference vegetation index and final yield was 0.86.
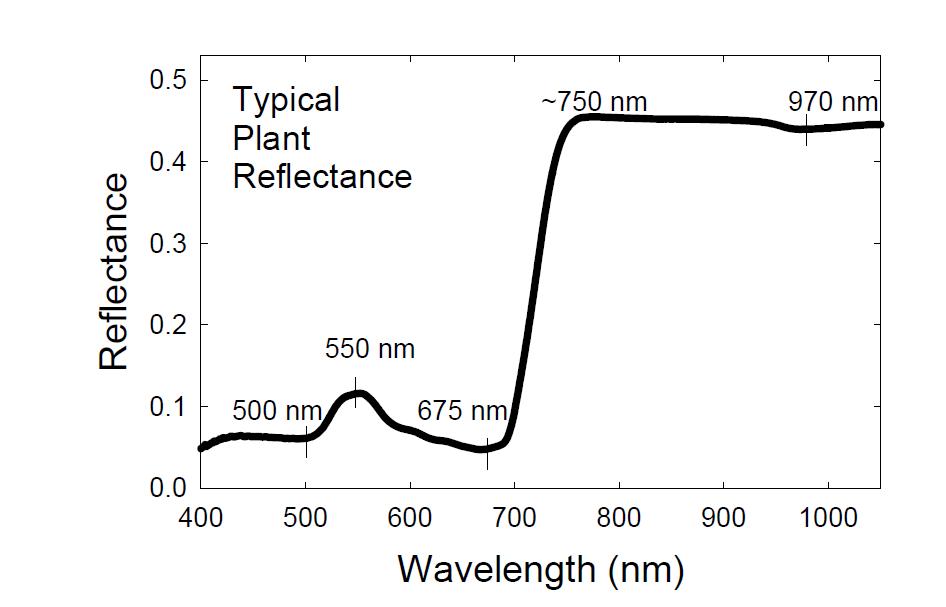

Typical visible and NIR plant reflectance. Spectral features at 500 nm, 550 nm, 675 nm, and the red edge (about 690 to 750 nm) are controlled by chlorophyll concentration, while reflectance at 970 nm is related to water concentration. And Using the linear nature of soil reflectance to eliminate soil background signal using derivatives of reflectance spectra (right).

Spectrometer mounting design for summer 2002 tests. A rigid swing arm positioned the spectrometer over the canopy away from the wheelbarrow.