SpectraWiz® VBA for MS Excel
Demo Programs including Absorption, Transmission, & LED Test ReportStellarNet offers the customizable StellarNet VBA programs for MS Excel that instantly grabs and graphs data from a StellarNet spectrometer. Setup and run from Excel in absorbance, transmission, or scope mode. With our VBA modules, you can rapidly customize your spectral analysis to meet your unique research requirements. You can integrate this module’s data acquisition capabilities into your existing analytical spreadsheet, thereby enabling the acquisition and analysis of spectral data without leaving the Microsoft Excel environment. Create custom reports, calculate and graph absorbance or percent transmission, all at the push of a button. It’s all here and more importantly, it is included free with your StellarNet spectrometer.
We have built several useful spreadsheets over the years including our NIST CRI/CQS calculator and also our LED Test Report spreadsheet. Email Contactus@StellarNet.us for more info.
SpectraWiz VBA v2 for Basic Spectral Acquisition, Absorbance, & Transmission
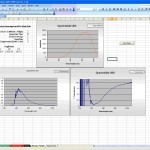
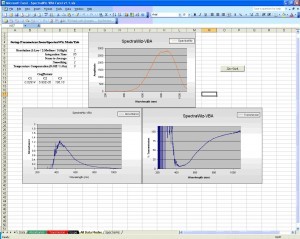 Excel’s VBA script functionality enables the user to query an instrument directly from Microsoft Excel. Data from the device is imported directly onto an Excel page for post data processing using user-defined algorithms. Above is the processed data graphics page of the module. Scope, absorbance, and transmission data are displayed simultaneously. Notice the noise below 400 nm in the absorbance and transmission curves. From looking at the scope mode data, you can quickly determine that this is due to the fact that there is no reference signal in this portion of the spectrum (and is therefore invalid). Adding a deuterium lamp would allow that spectral region to be measured.
VBA PDF
SpectraWiz VBA-NIST- CRI/CQS
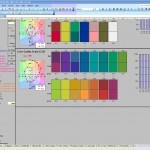
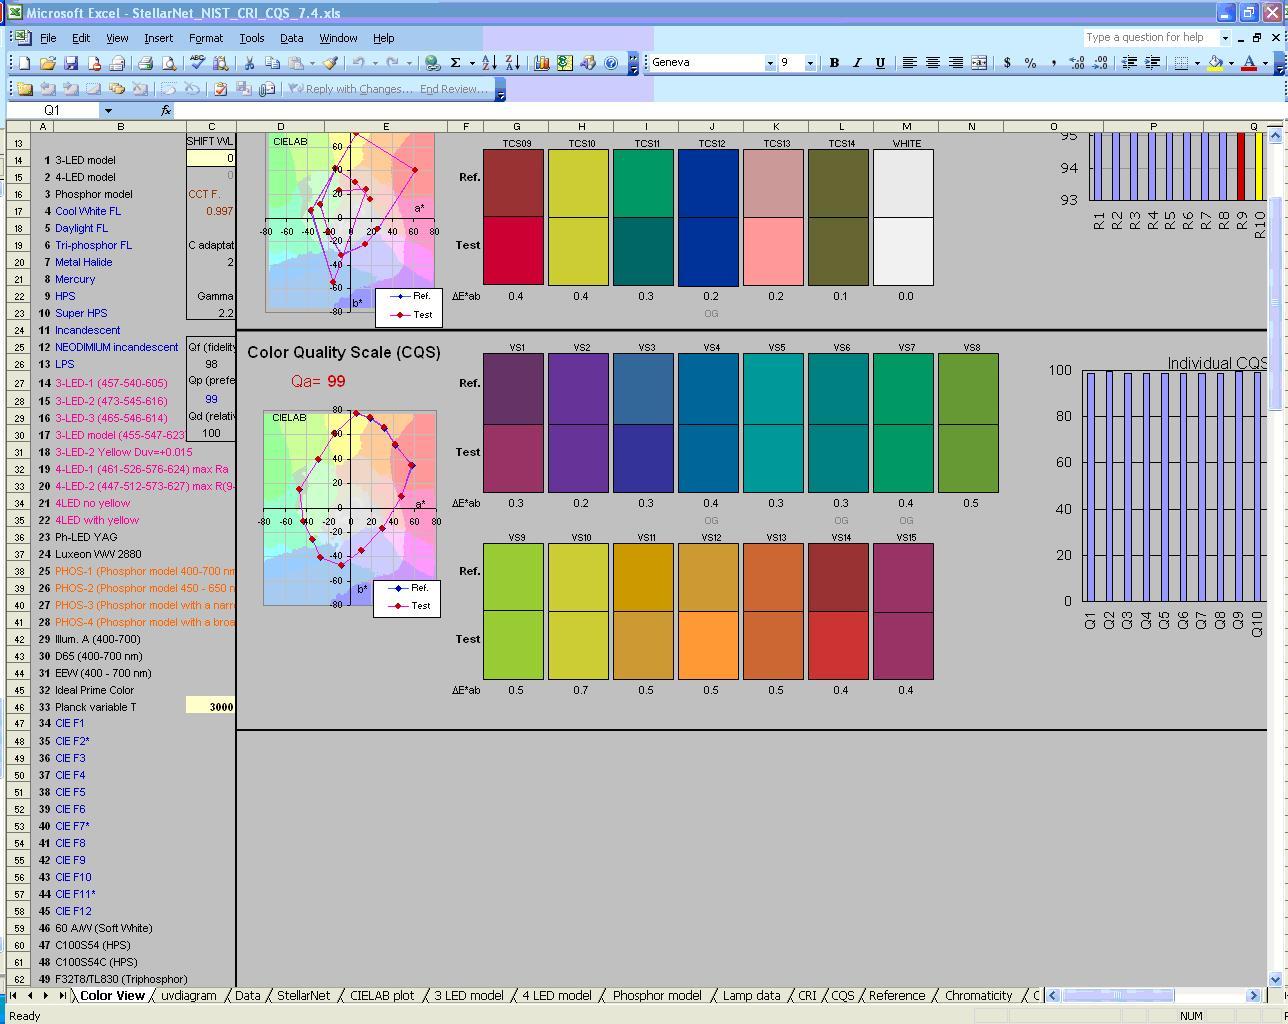
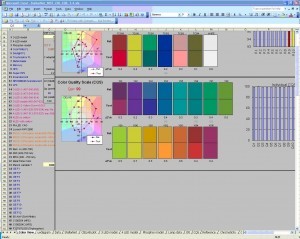 CRI & CQS calculations are performed in a comprehensive spreadsheet written by the folks at NIST. If you purchase a StellarNet spectrometer we’ll send you our free modified version that reads your instrument!
VBA LED Test Report Software
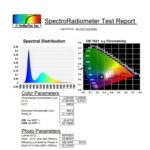
The SpectroRadiometer Test Report Software now enables customers to display and print all of the relevant test data 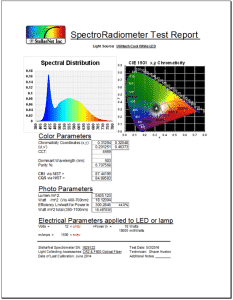 on one sheet making quality control and R&D efforts much more efficient.
The FREE VBA based software is built into an MS Excel spreadsheet and it automatically loads your spectrometer’s calibration coefficients and irradiance calibration data upon starting the program. With a click of a button, you can acquire a complete spectrum of your test light source and view its spectral distribution with an under the curve wavelength color representation view which can be helpful when showing a “non-technical” person how much of a certain color is represented in the measured light source.
The test report also shows the CIELAB diagram with the xy/u’v’ chromaticity values automatically updated for your light. Additionally, CCT (Correlated Color Temperature), PAR, dominant wavelength, and % color purity are calculated. The software also includes NIST created calculations for CRI (Color Rendering Index) and CQS (Color Quality Scale) and total power measurements in Lumens, Watts, or associated irradiance values with efficiency and efficacy values calculated as well based on your input electrical parameters.
Customize StellarNet VBA for MS Excel
It is so simple that anyone with Excel experience can modify the program to provide their own specific spectral calculations.
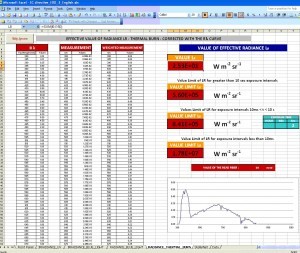
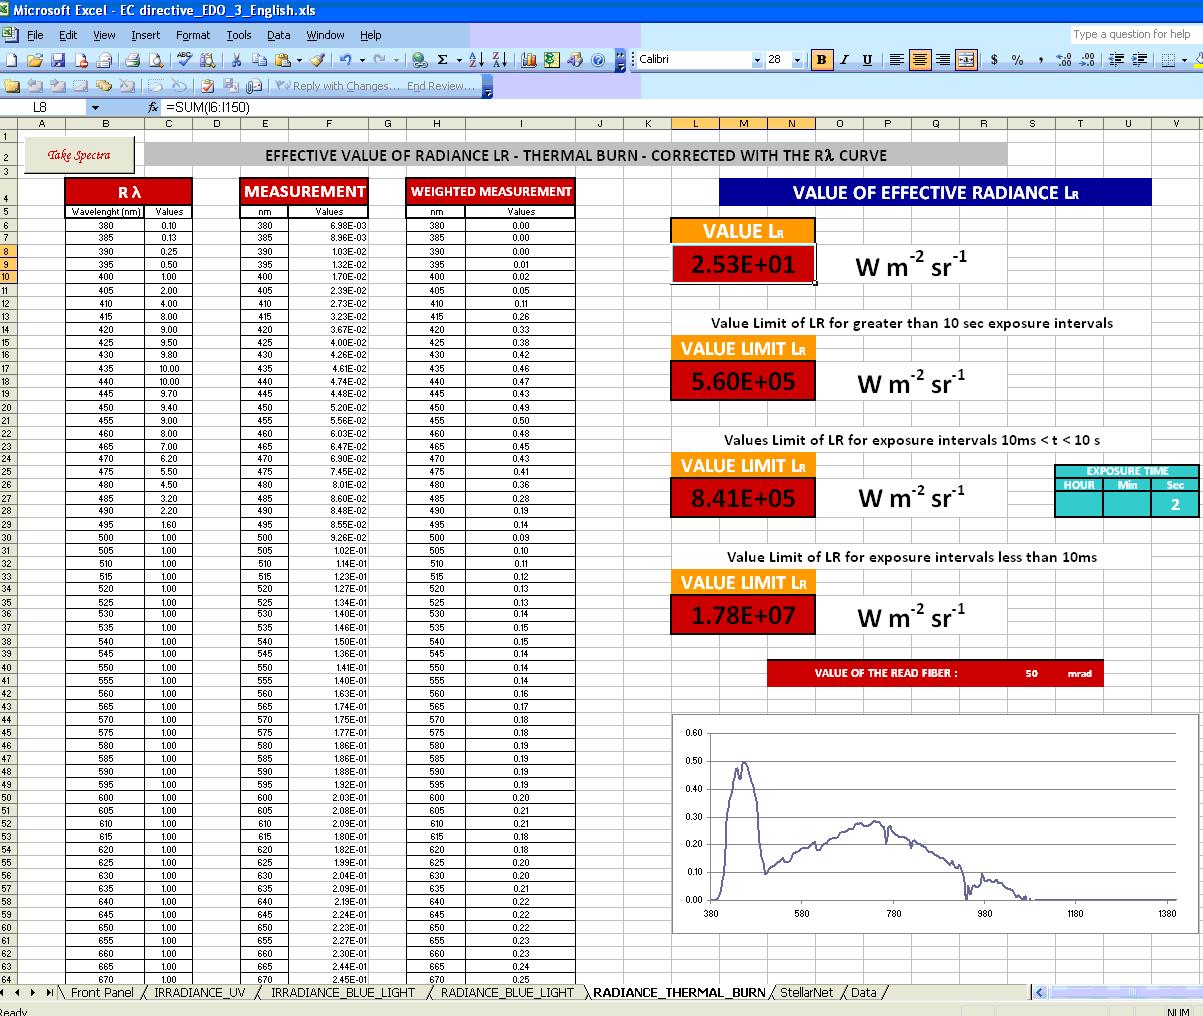
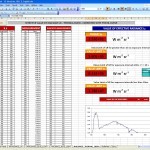
Above is a simple modification to SpectraWiz VBA to calculate thermal burn and irradiance/radiance per EC directive. Imported spectra is multiplied by a weighting function and spectral bins are calculated based on the directives guidelines.
System Requirements
While SpectraWiz can run on virtually any computer, SpectraWiz VBA for MS Excel does have some requirements.
SpectraWiz VBA for MS Excel requires the user to use a standalone version of Excel – it is not compatible with the 365 App version.
Excel should also be a 32-bit distribution.
If you have any questions about if your version of Excel will work with SpectraWiz VBA for MS Excel feel free to reach out to your Application Scientist or email us at ContactUs@StellarNet.us
Other Software Options
Technical Information Request
Cooking Oil Spectroscopy for the Perfect Thanksgiving Turkey
Happy Thanksgiving! Every year, we like to analyze popular Thanksgiving foods by using spectroscopy. As we gather around the Thanksgiving table, the spotlight shines on the star of the feast: the perfectly roasted turkey. While the turkey is often center stage, the...

