Published: 16 August 2023 | University of Pernambuco, Recife, Brazil


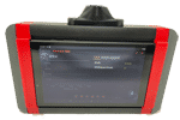
Figure 3 illustrates the detection and modulation modules used in this paper.


Figure 5. Optical spectrum: (a) green LED, (b) yellow LED, (c) both LEDs on simultaneously, and (d) after lock-in processing for the yellow LED subjected to noise emulated by a higher intensity green LED. Figure 6. Optical spectrum: (a) high-intensity white light and yellow LED separated, (b) high-intensity white light and yellow LED simultaneous, and (c) after lock-in processing for the yellow LED subjected to noise emulated by high-intensity white light. Figure 7. Results of the optical spectroscopy experiment in outdoor colloidal analysis for the (a) water only, (b) gold colloidal, and (c) after lock-in processing.
…The Detection Module consists of the StellarNet® BLUE -Wave Miniature Spectrometer (StellarNet, EUA, Tampa, FL, USA) (200–1150 nm wavelength range and 2048 element CCD sensor) and a notebook, as shown in Figure 3. The StellarNet obtains the optical spectrum through the SpectraWiz software of the manufacturer. The functionality SpectraWiz for exporting data is called Episodic Data Capture, with a maximum sampling rate of 1 ms, corresponding to 100 spectra captured in 1 s. The exported data is stored in its own encrypted format .EP1 or in a plain text format (.EP1x), posteriorly used by SpectroPlot to perform the lock-in processing…


