DAN LUBIN (a), MADISON L. GHIZ (b), SERGIO CASTILLO (c), RYAN C. SCOTT (d), SAMUEL E. LEBLANC (e,f), and ISRAEL SILBER (g)
Accepted 19 June 2023 | (a) Scripps Institution of Oceanography, La Jolla, California (b) DNV, San Diego, California (c) The University of Texas at Austin, Austin, Texas (d) NASA Langley Research Center, Hampton, Virginia (e) Bay Area Environmental Research Institute, Moffett Field, California (f) NASA Ames Research Center, Moffett Field, California (g) The Pennsylvania State University, University Park, Pennsylvania
Abstract
A field campaign at Siple Dome in West Antarctica during the austral summer 2019/20 offers an opportunity to evaluate climate model performance, particularly cloud microphysical simulation. Over Antarctic ice sheets and ice shelves, clouds are a major regulator of the surface energy balance, and in the warm season their presence occasionally induces surface melt that can gradually weaken an ice shelf structure. This dataset from Siple Dome, obtained using transportable and solar-powered equipment, includes surface energy balance measurements, meteorology, and cloud remote sensing. To demonstrate how these data can be used to evaluate model performance, comparisons are made with meteorological reanalysis known to give generally good performance over Antarctica (ERA5). Surface albedo measurements show expected variability with observed cloud amount, and can be used to evaluate a model’s snowpack parameterization. One case study discussed involves a squall with northerly winds, during which ERA5 fails to produce cloud cover throughout one of the days. A second case study illustrates how shortwave spectroradiometer measurements that encompass the 1.6-mm atmospheric window reveal cloud phase transitions associated with cloud life cycle. Here, continuously precipitating mixed-phase clouds become mainly liquid water clouds from local morning through the afternoon, not reproduced by ERA5. We challenge researchers to run their various regional or global models in a manner that has the large-scale meteorology follow the conditions of this field campaign, compare cloud and radiation simulations with this Siple Dome dataset, and potentially investigate why cloud microphysical simulations or other model components might produce discrepancies with these observations.
Keywords: Antarctica; Ice shelves; Clouds; Radiation; Instrumentation/sensors; Model evaluation/performance
Introduction
Antarctica is a critical region for understanding climate change and sea level rise, as the great ice sheets and the ice shelves are subject to increasing risk as global climate warms. Climate models have difficulties over Antarctica, particularly with simulation of cloud properties that regulate snow surface melting or refreezing. Atmospheric and climate-related field work has significant challenges in the Antarctic, due to the small number of research stations that can support state-of-the-art equipment. Here we present new data from a suite of transportable and solar-powered instruments that can be deployed to remote Antarctic sites, including regions where ice shelves are most at risk, and we demonstrate how key components of climate model simulations can be evaluated against these data.
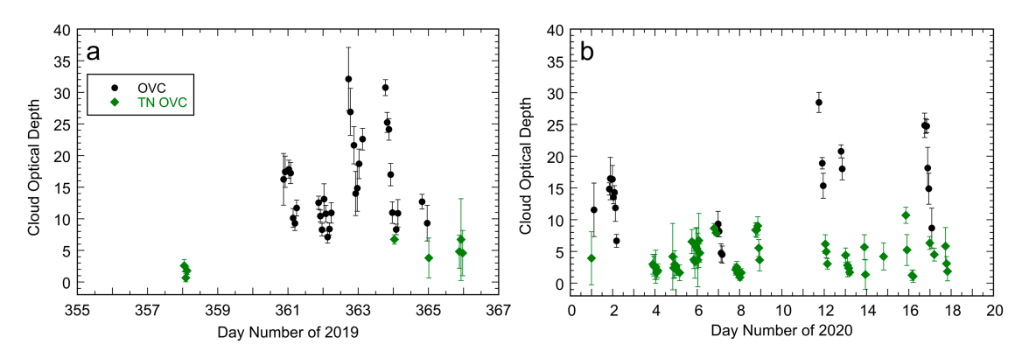
FIG. 5. Conservative scattering cloud optical depth, hourly averaged, for all spectroradiometer data obtained at Siple Dome under overcast skies. Data are averaged over the packets of (most often) 60 spectra as recorded by the StellarNet (Inc.) software. Error bars depict plus or minus one standard deviation.
The shortwave spectroradiometer system consisted of two StellarNet (Inc.) spectrometer modules connected by fiber optic cables to a single radiometric cosine receptor, an upward-looking Teflon diffuser sampling shortwave irradiance (flux) from the full 1808 field of view. The visible wavelength range (350–1150 nm) is covered by a miniature BLUE-Wave spectrometer with a 2048 element Si detector array and 50-mm slit, for a spectral resolving resolution of 1.6 nm. This spectrometer was powered directly by the datalogging computer’s USB port. The near-infrared wavelength range 900–1700 nm is covered by a miniature DWARF-Star spectrometer with a 512-element InGaAs photodiode array and 25-mm slit for a resolving resolution of 2.5 nm. A thermoelectric cooler maintains the detector temperature at 2108C. Both spectrometers have 16-bit digitization and integration times as fast as 0.1 ms.
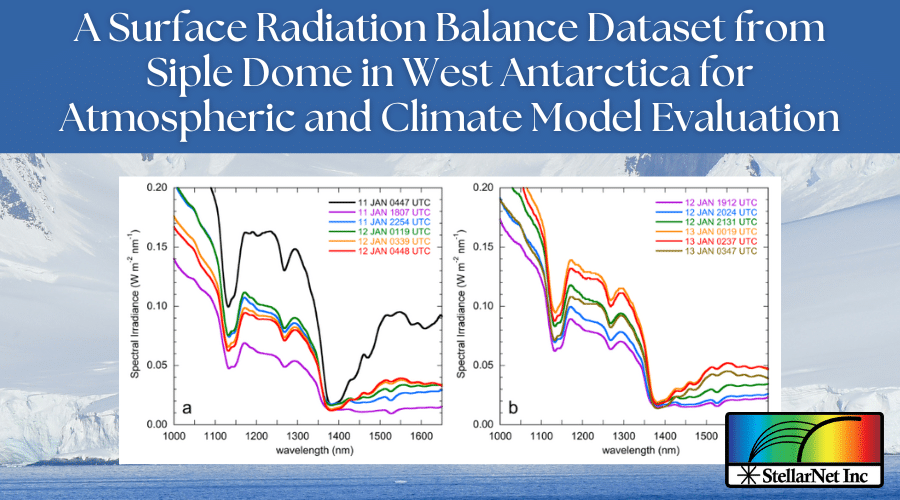
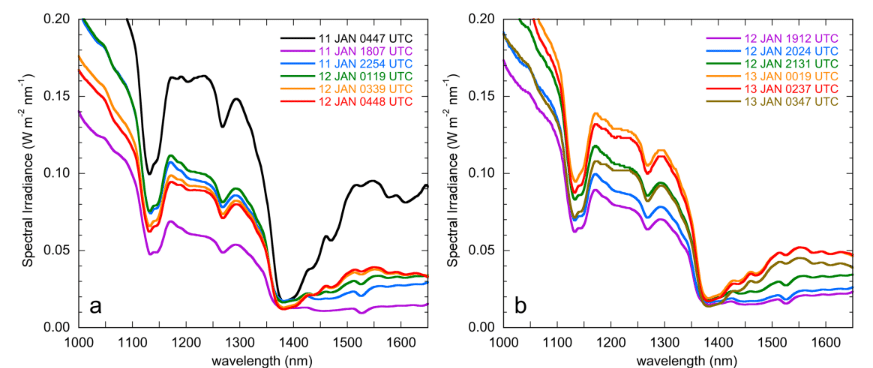
FIG. 11. Examples of near-infrared downwelling spectral irradiance measured by the StellarNet (Inc.) spectroradiometer during the mixed-phase cloud life cycle case study 10–13 Jan 2020 during the (a) first diurnal cycle and (b) second diurnal cycle. The spectrum recorded at 0447 UTC 11 Jan 2020 was obtained under clear skies. The other spectra were obtained under overcast skies at various stages of cloud evolution.
These parameters denoted by h3, h8, and h15, were originally derived for transmitted zenith spectral radiance Ll, but here we show that they can be applied to the spectral irradiance as measured by the StellarNet instrument at Siple Dome.

