Whitney G. Walkowski ,Corinne L. Richards-Zawacki,William C. Gordon,Nicolas G. Bazan,Hamilton E. Farris
Published: November 14, 2024 | Louisiana State University Health Science Center, Smithsonian Tropical Research Institute
Abstract
Research on visually driven behavior in anurans has often focused on Dendrobatoidea, a clade with extensive variation in skin reflectance, which is perceived to range from cryptic to conspicuous coloration. Because these skin patterns are important in intraspecific and interspecific communication, we hypothesized that the visual spectral sensitivity of dendrobatids should vary with conspecific skin spectrum. We predicted that the physiological response of frog retinas would be tuned to portions of the visible light spectrum that match their body reflectance. Using wavelength-specific electroretinograms (ERGs; from 350-650 nm), spectrometer measurements, and color-calibrated photography of the skin, we compared retinal sensitivity and reflectance of two cryptic species (Allobates talamancae and Silverstoneia flotator), two intermediate species (Colostethus panamansis and Phyllobates lugubris), and two conspicuous aposematic species (Dendrobates tinctorius and Oophaga pumilio). Consistent with the matched filter hypothesis, the retinae of cryptic and intermediate species were sensitive across the spectrum, without evidence of spectral tuning to specific wavelengths, yielding low-threshold broadband sensitivity. In contrast, spectral tuning was found to be different between morphologically distinct populations of O. pumilio, where frogs exhibited retinal sensitivity better matching their morph’s reflectance. This sensory specialization is particularly interesting given the rapid phenotypic divergence exhibited by this species and their behavioral preference for sympatric skin reflectances. Overall, this study suggests that retinal sensitivity is coevolving with reflective strategy and spectral reflectance in dendrobatids.
Introduction
Visual systems have evolved in response to a variety of selective pressures, including in the context of natural and sexual selection. The result is that across taxa there is extensive variance in several properties of visual processing, as species may exhibit specializations for different levels of photon capture (diurnal vs. nocturnal), spatial resolution, or wavelength sensitivity. The latter is the focus of this study. Using a comparative approach with several species of diurnal frogs we tested if retinal physiological responses to stimuli with different wavelengths vary with species’ visual ecology and skin reflectance spectra.
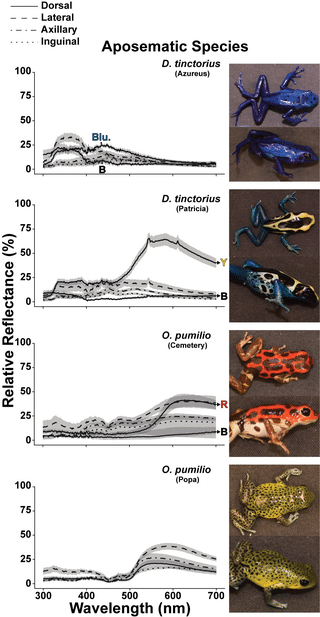
Fig 1. Reflectance data for morphs within aposematic species, D. tinctorius and O. pumilio.
Lines indicate the average relative reflectance (%) across the wavelength (nm) spectrum. Shading around each line indicates the S.E. of each dataset. Morphological regions are differentiated by line type, where solid lines are dorsal, dashed are lateral, dash-dot are axillary, and dotted are inguinal measurements. Arrows point from a subset of reflectance curves to filled letters, which correspond to subregions of distinct colors, as detected by the human eye (Blu.= blue, B= black, Y= yellow, and R=red). For all quantitative analysis of spectrometer data refer to S1 Table. Example, dorsal and lateral photographs for morphs are included to the right of each reflectance graph. Quantitative analysis of photographs which scales reflectance measurements by morphological region can be found in Fig 4.
Analysis of spectral reflectance data collected across all morphological regions was accomplished using principal component analysis to test if a specimen’s reflectance curve sorted species by their hypothesized reflectance strategies (Fig 3). When PC1 (21.2% of the variance in dataset) and PC2 (16.6% of the variance in dataset) were plotted, we found that the PCA distribution of the cryptic species’ reflectance data showed extensive overlap with each other and almost no overlap with any other, suggesting these two species reflective strategies are most like one another and different from aposematic and intermediate strategies.
We used a BLK-C spectrometer outfitted with a SL1-SL3 Combo lamp setup to measure the spectral reflectance of frog surfaces (StellarNet, Inc.), particularly the dorsal, lateral, axillary, and inguinal regions of each frog. Any distinct morphological markings (e.g., a prominent stripe or spot) were also measured within each region. All spectral reflectances were calculated as a percent of reflectance compared to the RS50 (StellarNet, Inc.) white standard. Curves were captured (SpectraWiz;StellarNet, Inc.), saved (TRM files) and imported to Spectragryph (Dr. Friedrich Menges Software-Entwicklung; Spectroscopy Ninja) for analysis of the peak reflectance (nm), full width half maximum (FWHM; nm), area under the curve from baseline (AUC; % * nm), and average reflectance (%) across the entire spectrum (S1 Fig).


