This feature enables administrators to efficiently manage and customize data within specific applications through intuitive controls and advanced configuration options.
- Log in to an administrator account.
- Navigate to the ‘Settings’
 by clicking on the last option in the Application bar on the left.
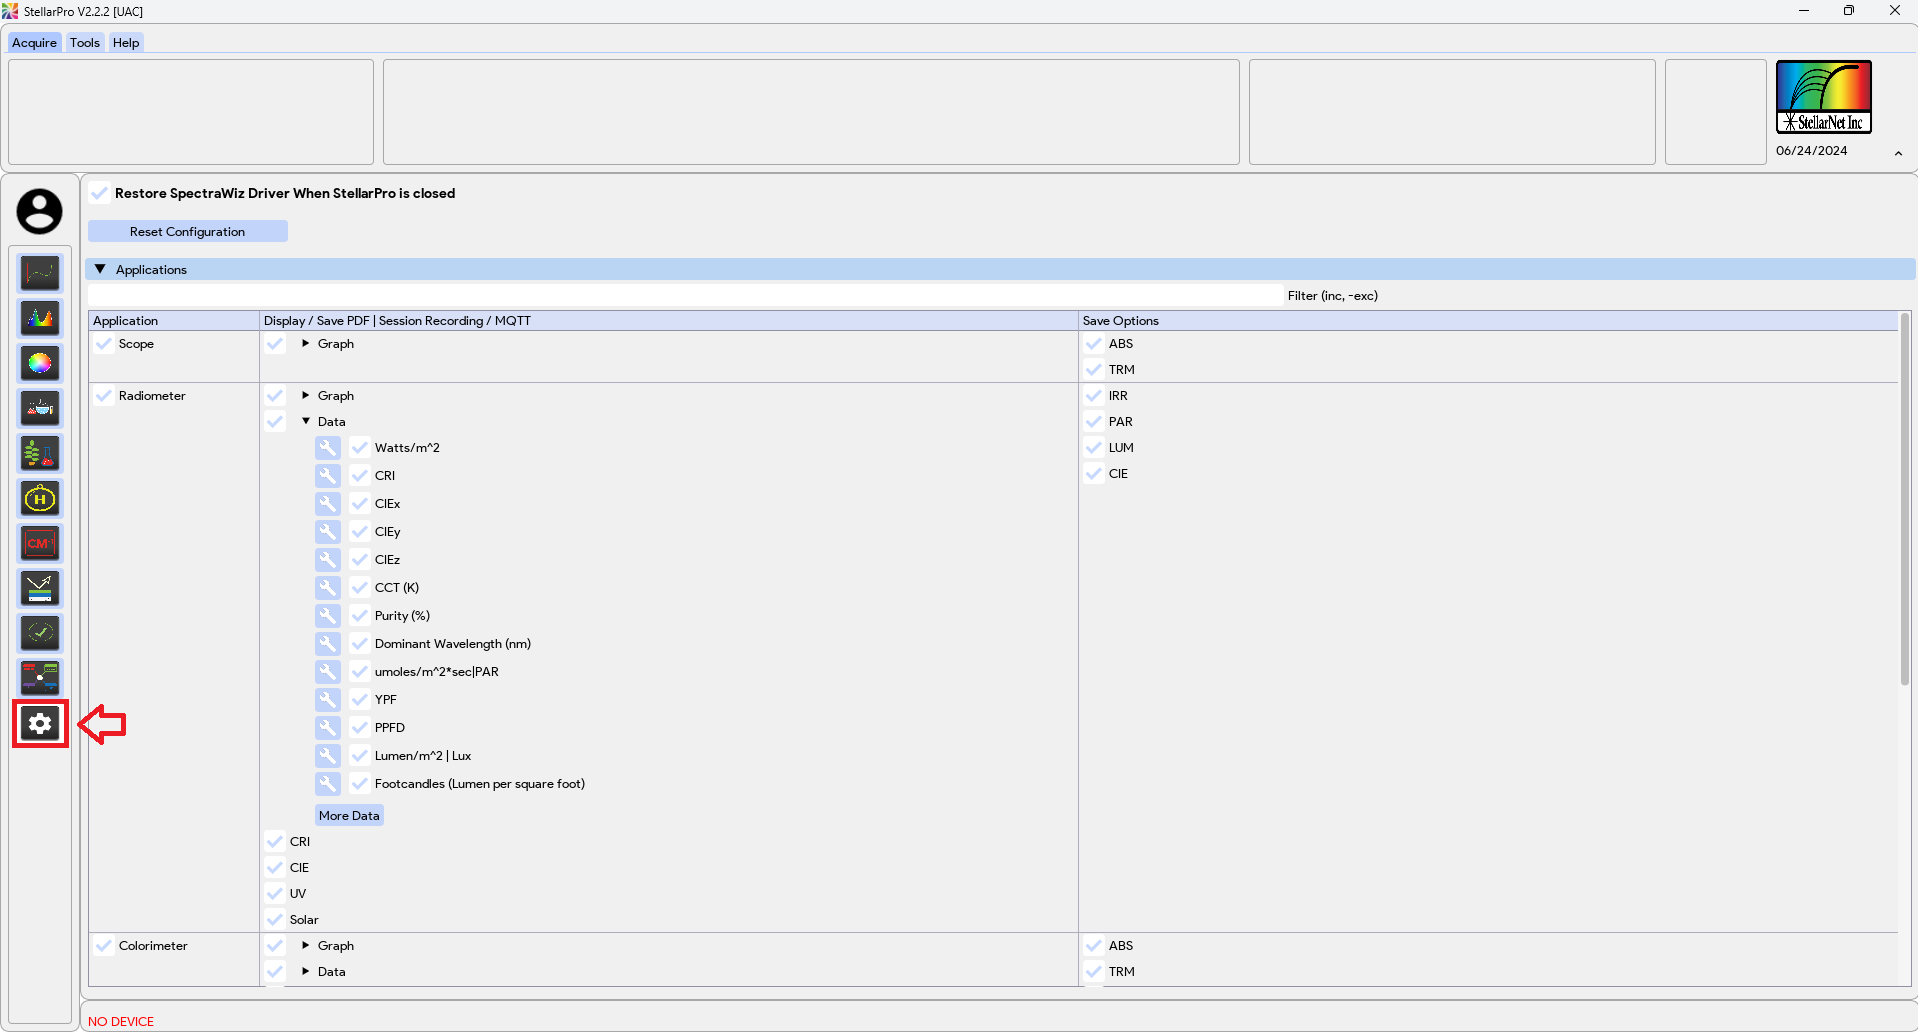
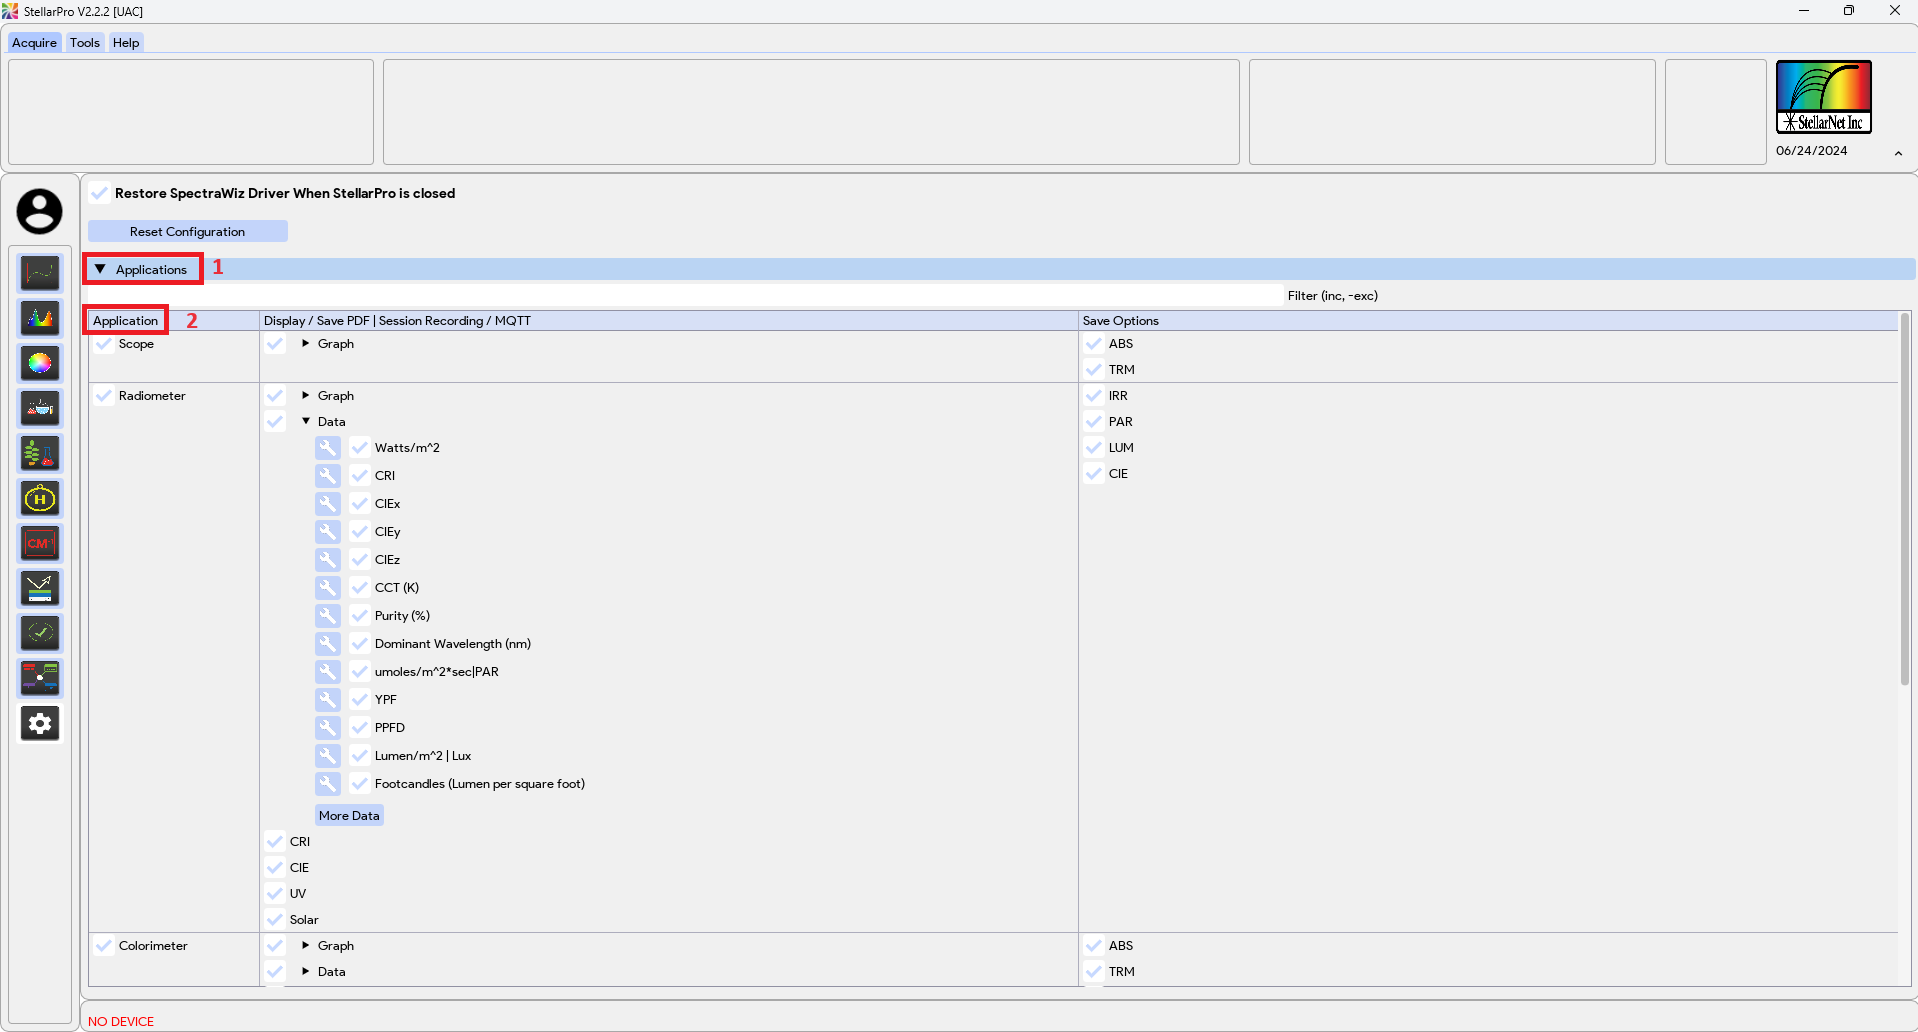
- Expand the ‘Applications‘ tab and locate the application in the ‘Application‘ column where you would like to edit or add the new custom data.
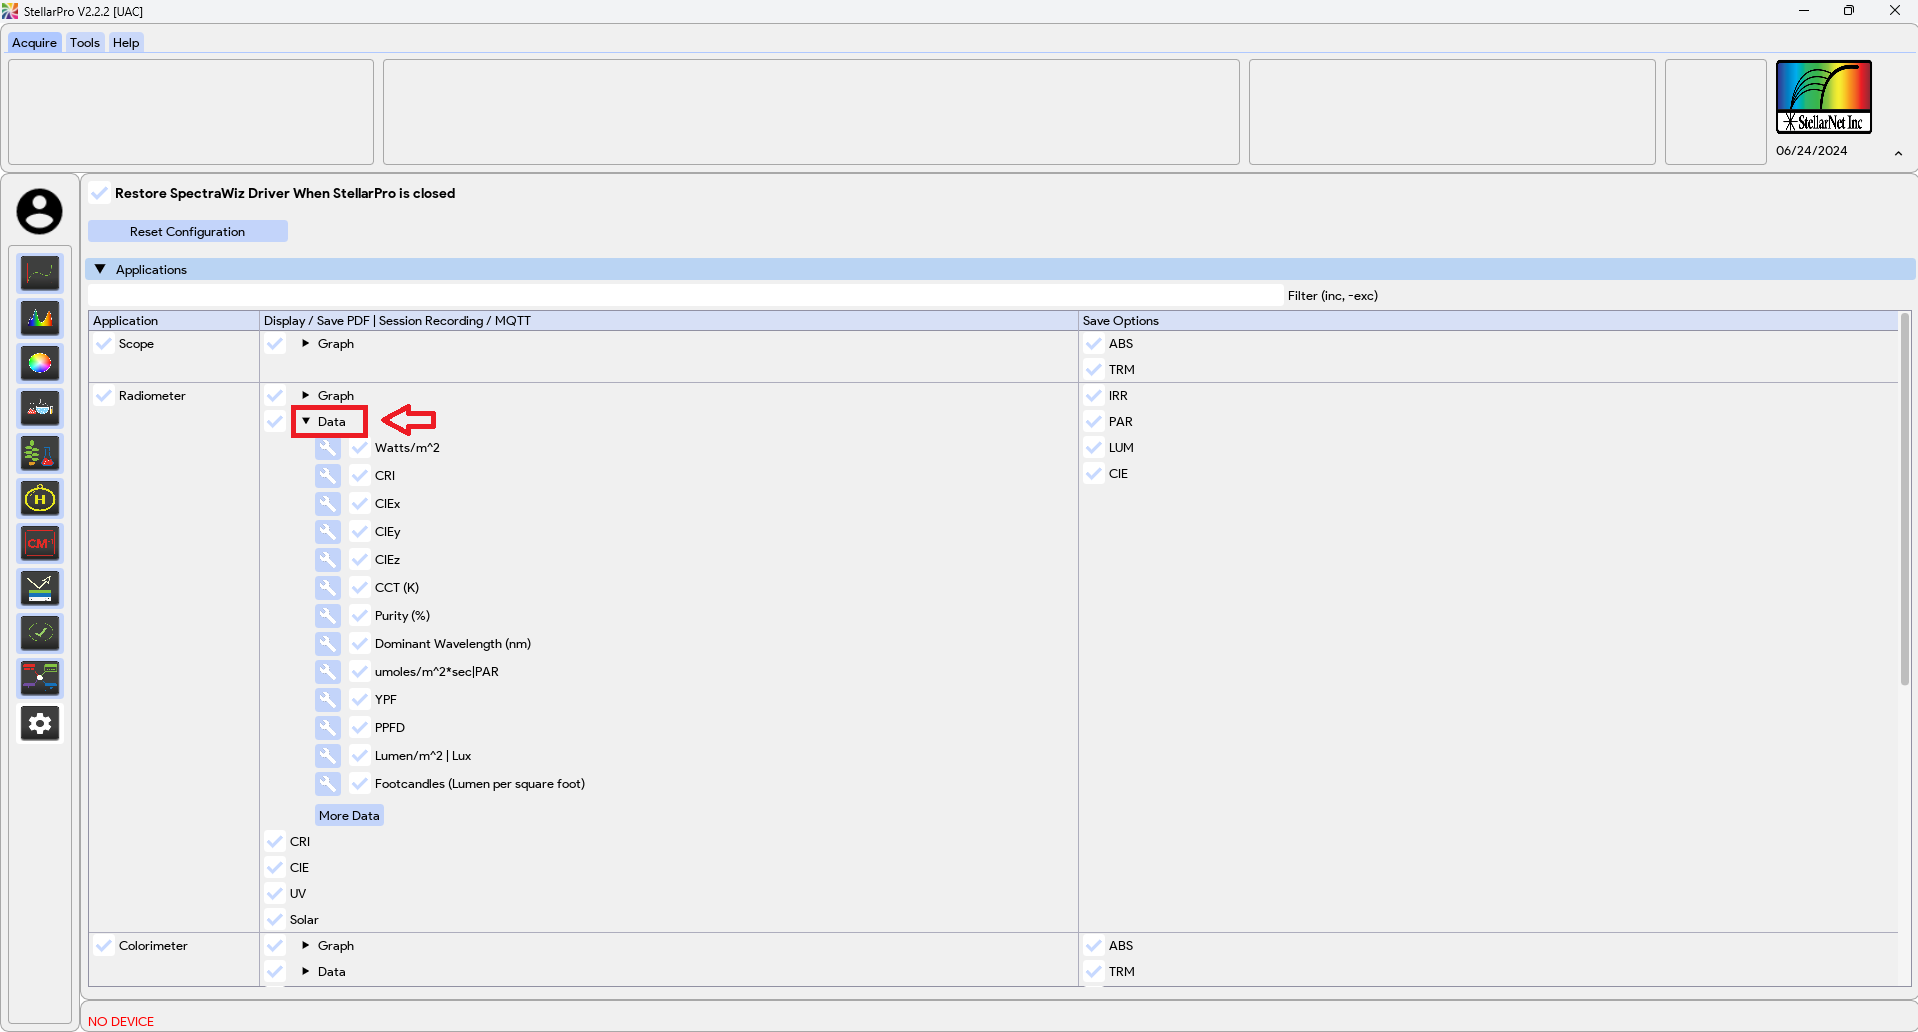
- In the second column of that application, named ‘Display / Save PDF | Session Recording / MQTT’, expand the ‘Data’ tab. Here, you will see a list of all the data available in the data table for that application. Note: Not all application have this ‘Data’ tab.
- Display Data Elements. You can add or remove specific data elements from the data table by enabling or disabling the checkbox next to each data element. Note: Removing a data element from the data table will delete the corresponding data upon saving.
Data Monitoring with Pass-Fail Criteria
This feature allows you to configure the data monitoring pass and fail criteria for that specific data, such as thresholds (greater than, less than, or equal, etc.). The color and label of the data monitoring condition can be adjusted for each specific element, updating the data based on the conditions set in the data table.
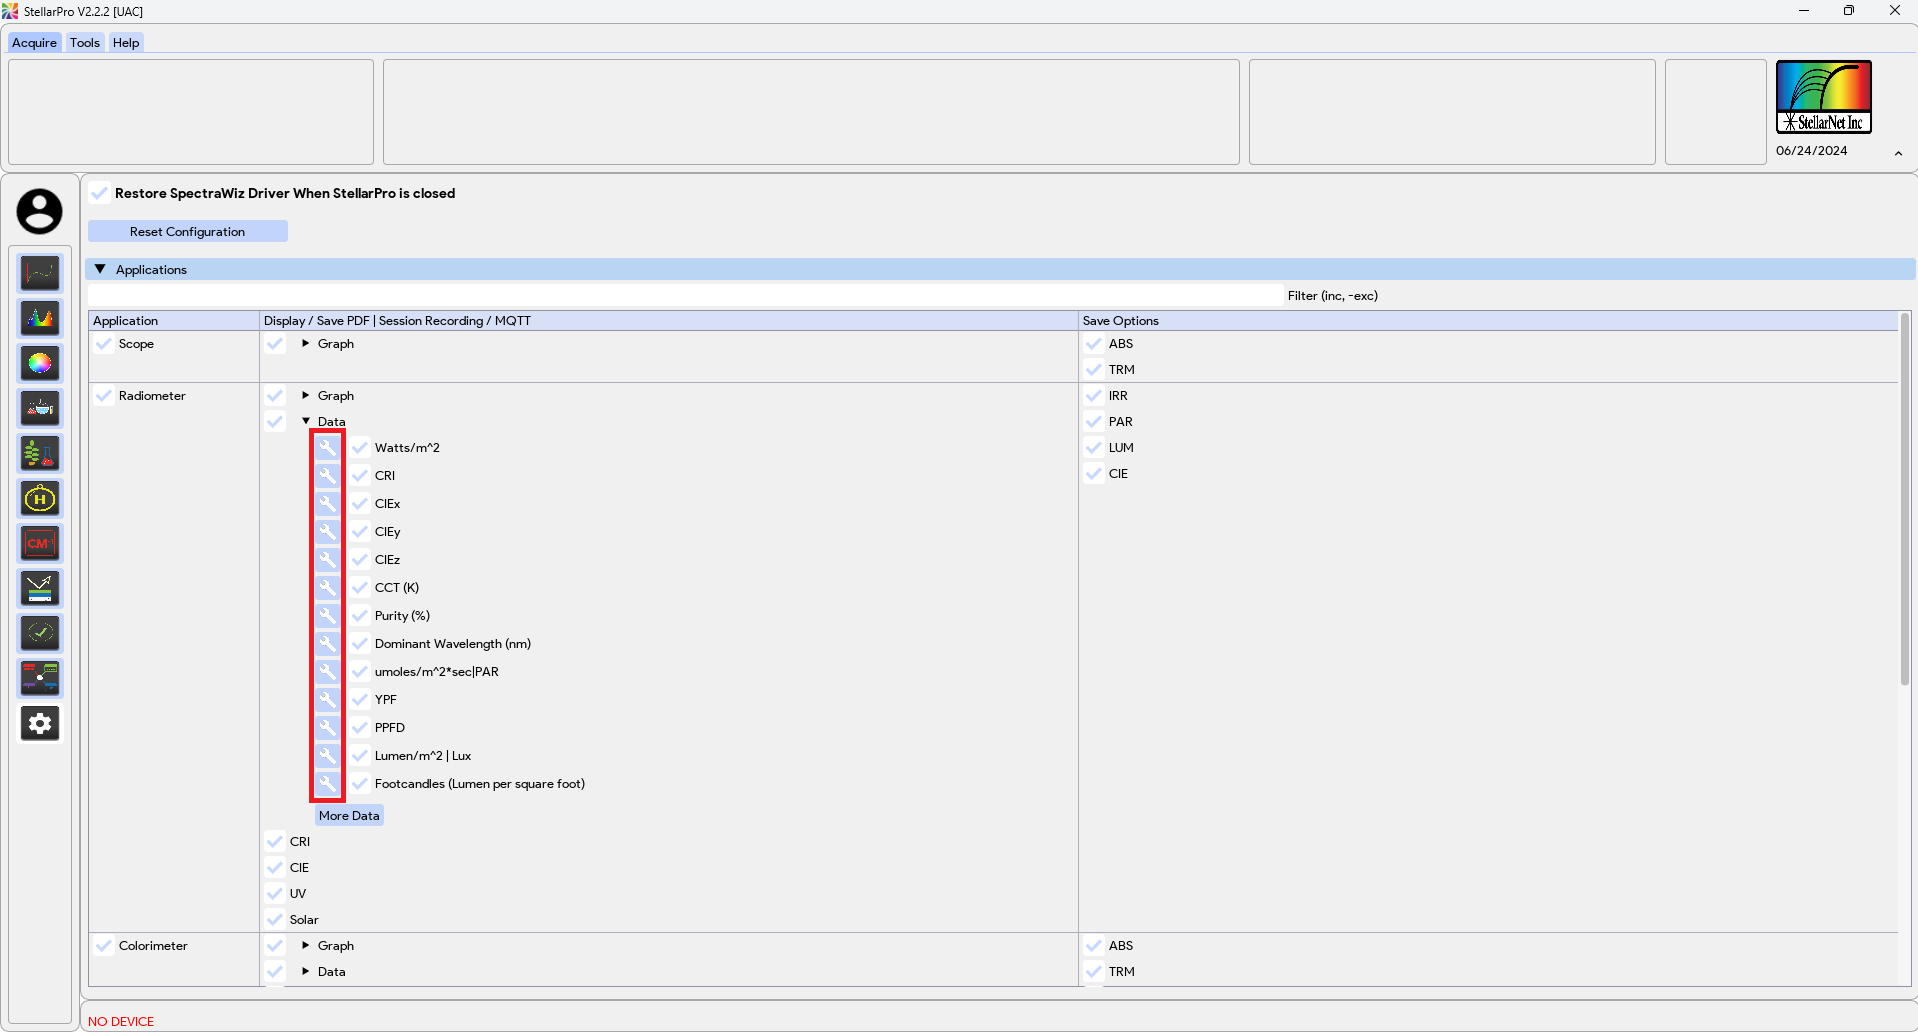
- Click on the wrench icon
 next to the element that you want to monitor, and the Pass-Fail window will be displayed. next to the element that you want to monitor, and the Pass-Fail window will be displayed.
- In the Pass-Fail window for the specific data element, check the box next to ‘Pass-Fail Criteria Enabled’ to activate the criteria monitoring feature.
- Select the desired pass/fail criteria from the dropdown menu, and then input the threshold value.
- The ‘TRUE Label’ section allows you to set the color and text that will be applied to the data in the data table if the value meets the criteria you set. The ‘FALSE Label’ section allows you to set the color and text for when the value does not meet the criteria. For example, if you set the threshold to less than 30, the true parameters will be applied when the value is less than 30, and the false parameters will be applied when the value is 30 or above.
- Click the ‘Done’ button to save the parameters.
|
More Custom Data
This feature allows you to add more custom data to the data table. This data can be based on calculated spectra, such as minimum, maximum, average, sum, or values at specific wavelengths for a particular graph type.
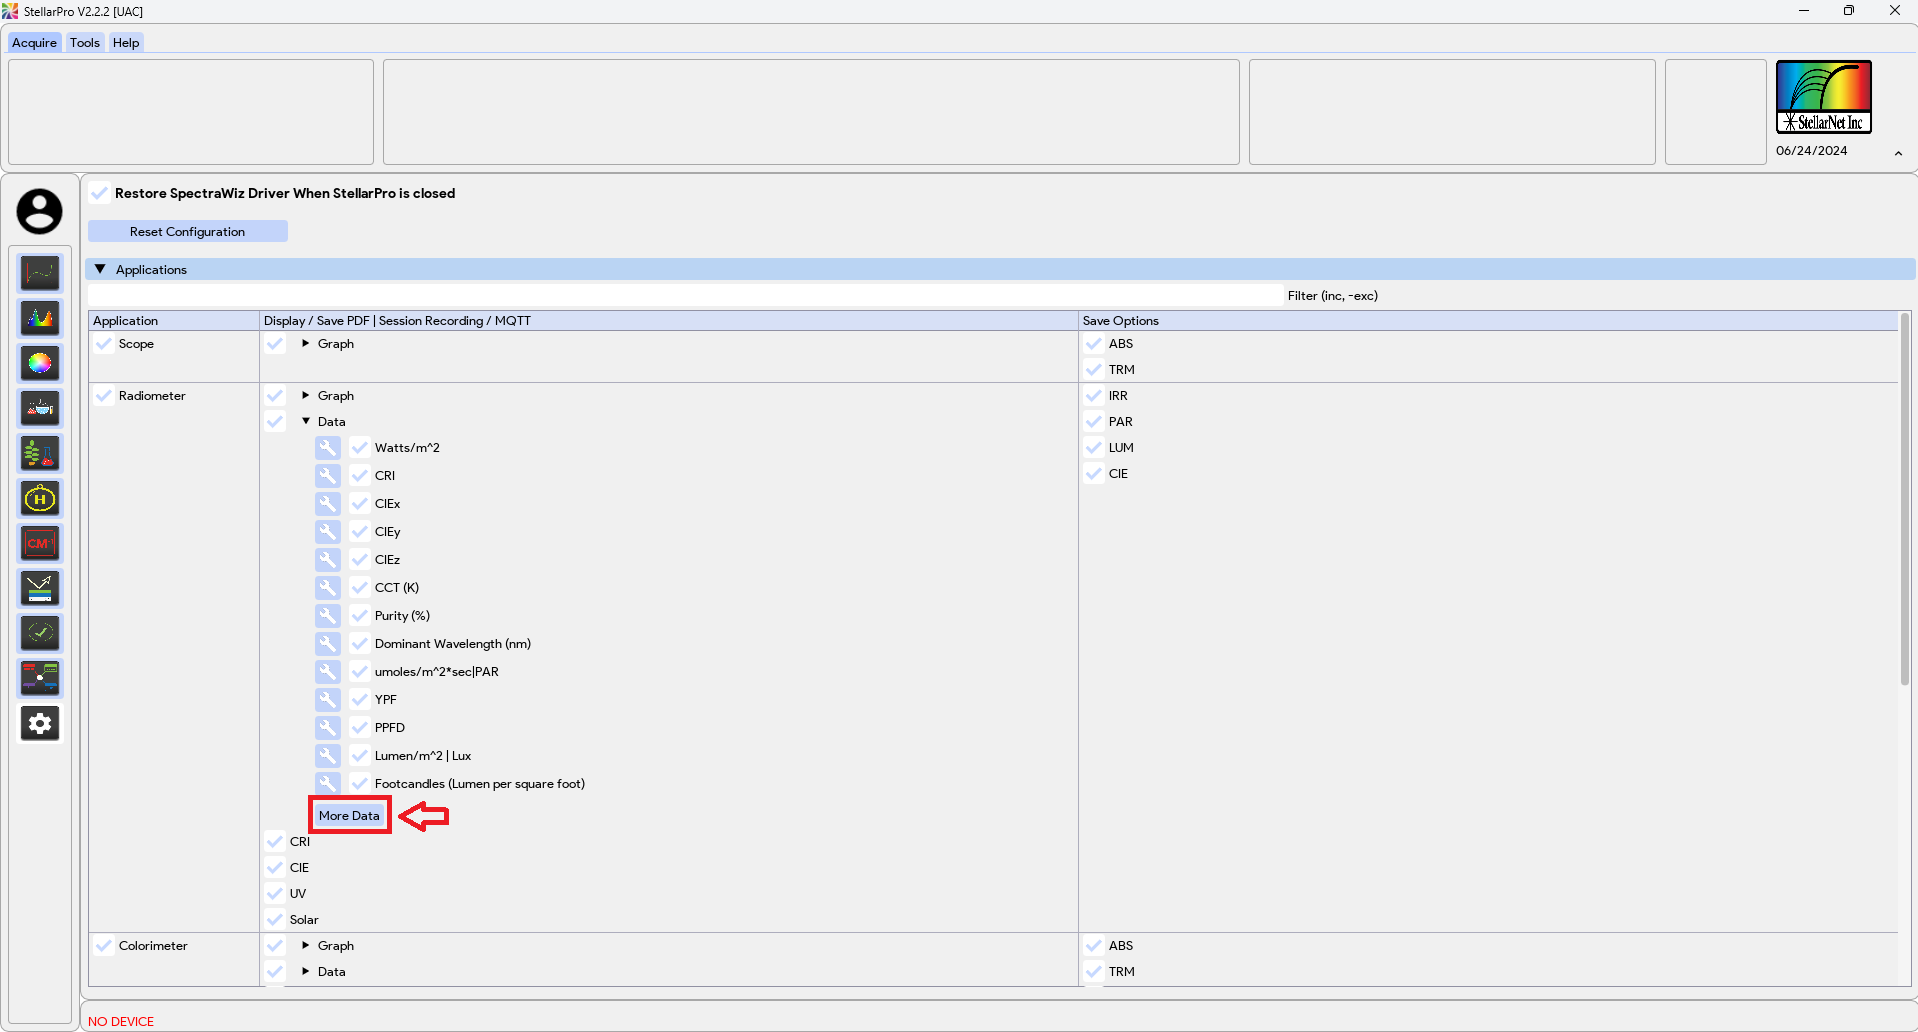
- Scroll to the bottom of the ‘Data’ tab, where you will find a ‘More Data’ button. Click on it to open the data addition window.
- In the ‘Title‘ field, enter the name of the data you want to display in the data table.
- In the ‘Graph Type’ dropdown, select the graph or spectrum type you want to base the new data on.
- In the ‘Graph Calculation‘ dropdown, choose the mathematical calculation you would like to perform based on the graph or spectrum selected in the previous step. Note: The available graph/spectrum options will depend on the application you are using.
- Enter the desired value(s) based on the selected calculation type:
- @ Wavelength: Enter a specific wavelength in nm that you want to monitor.
- Sum: Enter the start and end wavelengths in nm to calculate the total sum over that interval.
- Average: Enter the start and end wavelengths in nm to find the average value over that interval.
- Maximum: Enter the start and end wavelengths in nm to find the maximum value over that interval.
- Minimum: Enter the start and end wavelengths in nm to find the minimum value over that interval.
- Click the ‘Add’ button to add the data to the table.
- Now, navigate back to the application where you added the data. Click the ‘Capture Data’ button, and you will see the newly added custom data displayed in the data table.
|
