 |
File open
- Click to open saved file, this is the same as menu, File -> Open -> Sample
|
 |
Save sample spectrum
- Click to save the spectra, this is the same as menu File -> Save -> Sample (to disk)
|
 |
Print graph
- Left click to print graph.
|
 |
Snapshot spectra
- Left click here to freeze graph trace; Left click again to resume; Right click to copy graph to Windows clipboard
|
 |
Save dark spectrum (used for Absorbance, Transmittance, and Irradiance modes).
- Left Click after turning off light source;
- Right Click to release previous dark (zero)
|
 |
Save reference spectrum (used for Absorbance and Transmittance modes).
- Left Click after turning light on without sample in place or with white reference.
- When viewing Irradiance watts per square meter, clicking here starts the UV monitor application.
|
 |
Move Data Cursor Left |
 |
Move Data Cursor Right
- After placing the data cursor (by pointing and clicking the right button), each subsequent click, using the left button, will move 1 pixel in direction selected. To remove data cursor click to left of graph. Clicking the right button on these icons will seek to the next peak in the selected direction, and place the data cursor there.
|
 |
Zoom wavelength
- A reminder on how to X- and Y-zoom.
- Left click here again to un-zoom.
- Left click on the left side of graph to un-zoom.
- Right click to enable Y-zoom mode.
|
 |
Re-scale Y axis
- Left click to auto scale Y-axis.
- Right Click to undo auto scale Y-axis.
- Also use View Y set scale menu to override auto scale with selected scale.
|
 |
Compute Area
- Left click to show the AreaPSD, Centroid, Peakwave, FWHM, and Centbase of a peak. If the data cursor is not on a peak, the icon will seek to a peak in the closest direction.
- Right Click to start dual data cursor measurement as outlined below.
- This information is printed in the graph title (concatenated to end of line) when printing a graph.
|
 |
Auto-Integration
- Left Click to automatically adjust detector integration time and averaging using reference light source in scope mode
|
 |
Detector Integration Time
- Left click to set detector integration time
|
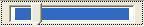 |
Integration Time Bar
- Slide bar with mouse to manually configure the integration time.
- Moving the bar to the left, decreases the integration time.
- Moving the bar to the right, increases the integration time.
|
