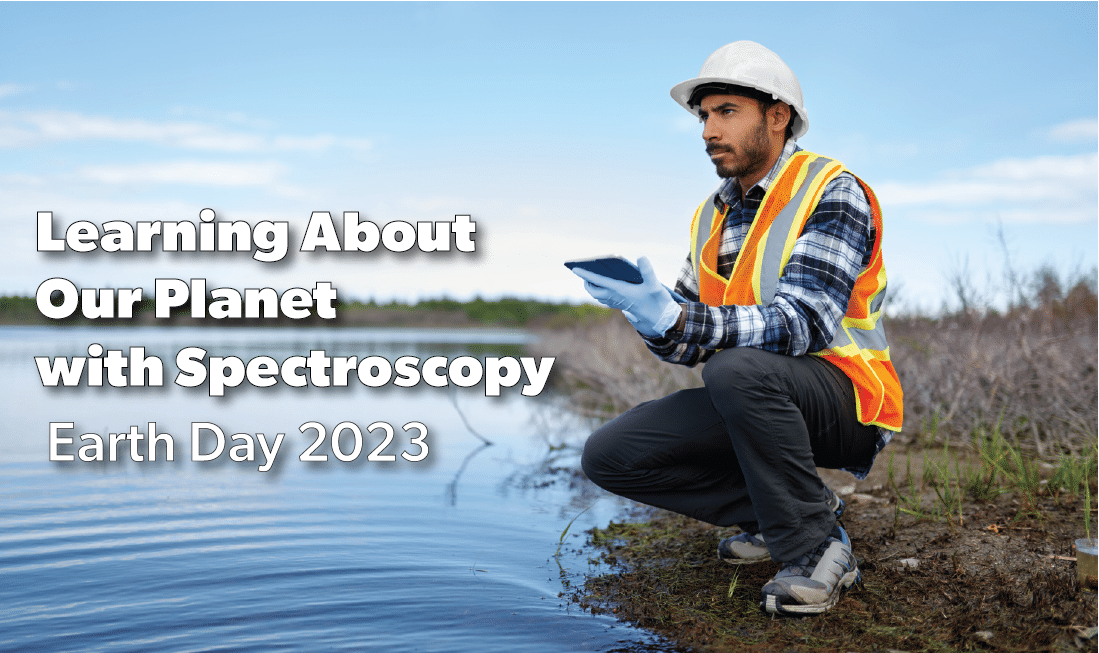
Thanks to advances in spectroscopic technology, environmental scientists and researchers are afforded reliable methods to assess the impact of pollution and climate change on our natural resources and environment. Here are just a few ways scientists can use our spectrometers to learn more about the planet we come from!
Vegetation and Forestation Spectroscopy
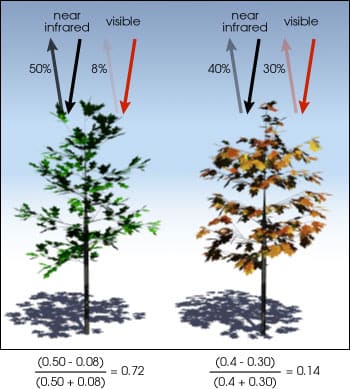
NASA has been able to use Vegetation indices, which are combinations of surface reflectance at two or more wavelengths designed to highlight a particular property of vegetation, can depict spatiotemporal patterns of the timing of plant growth, senescence, and dormancy at seasonal and inter-annual time scales.1 These spectroscopic methods allows researchers to monitor and scope out climatic changes that could be the results of pollution, human interreference and more. IOP researchers were able to study the reflectivity temporal dynamics of storing coniferous and deciduous woody specimens in cooling storage is ideal for industrial pollution detection in our atmosphere affording environmental scientists a pathway to monitoring air quality.
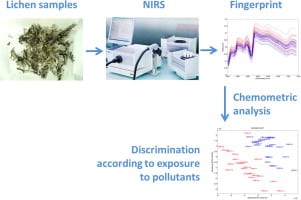
Diagram depicting Lichens used as a biomarker for air pollutants after NIRS and chemometric analysis.4
In 2015, Italian researchers were able to use NIR spectrometers to create a fingerprint for lichens, employing these lichen for their biomonitoring abilities to detect the presence of other substances in our atmosphere. As we continue to make a global effort to investigate and address climate change and changing air quality, these types of studies become more relevant to help scientists find a solution. NIR spectroscopy is regularly deployed by organizations, such as NASA, to observe vegetation density and derive vegetation indices (VI). With these observations, environmental scientists can monitor the development or degradation of our forests.
Air and Water Quality Spectroscopy
UV-VIS spectrometers are used everyday to determine water quality. Increased presence of iron and other metallics in our drinking water can lead to discoloration and a metallic taste in our drinking water. According to the EPA, long term elevated exposure to these secondary containments can lead to chronic toxicity and organ damage (liver, kidneys and intestines). This is why water treatment facilities have an obligation to mitigate the presence of metallics and monitor levels of exposure. It goes beyond our direct consumption of water. To protect the environment, pollutants and toxins found in wastewater require attention as well. Agricultural and Municipal wastewater carries pollutants such as pesticides and pathogens that can negatively impact the water quality of our environment.
UV-Vis spectrometers are reliable tools for measuring environmental pollutants due to their high sensitivity and selectivity. With the aid of UV-Vis spectrometers, scientists can identify areas of concern and develop a plan of action. In 2017, the Boyd Group at Erskine College were able to build a device characterized by our Blue-Wave spectrometer to treat blackwater (waste water that comes from toilets, dishwasher and food prep sinks), degrading contaminants found within. This is just one of the many ways spectroscopy can be used to improve water quality.
Environmental Spectroscopy in Action
Earth Day Customer App Notes
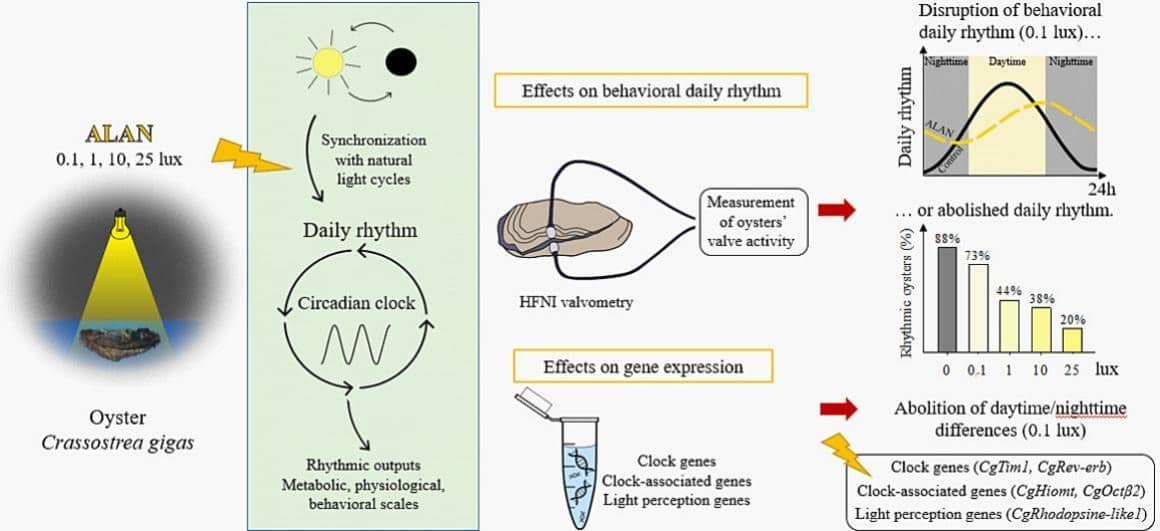
Artificial light at Night (ALAN) can have damaging effects on natural wildlife and even on humans. ALAN disrupts biological rhythms and sleep cycles yet they maintain a consistent presence in a growing modern world where human populations push further into the natural wildlife habitats. To understand the extent of this disruption, French researchers studied the effects on coastal wildlife by observing the the behavior of Crassostrea gigas, a species of oysters.
Spectroscopy is used by environmental scientists and researchers to derive vegetation indices by measuring the light reflection of vegetation. At the IOP conference, researchers unveiled their study of the temporal dynamics of woody vegetation reflectivity. This study focused on how well woody vegetation samples retained their reflective properties over a period of time and under varying conditions of storage.
StellarNet Plants a Tree
The Food and Agriculture Organization of United Nations (UN FAO) estimates that 10 million hectares of trees are cut down every year. Habitat loss displaces natural wildlife and creates an imbalance in ecological systems and processes. That’s why StellarNet will donate to the Canopy Project to plant trees for every spectrometer purchased this month. Our efforts will combat the devastating effects of deforestation and pollution. Help us bring back the trees and contact us today.
The StellarNet Team wishes you a wonderful Earth Day!
- Leng, S.; Huete, A.; Cleverly, J.; Yu, Q.; Zhang, R.; Wang, Q. Spatiotemporal Variations of Dryland Vegetation Phenology Revealed by Satellite-Observed Fluorescence and Greenness across the North Australian Tropical Transect. Remote Sens. 2022, 14, 2985. https://doi.org/10.3390/rs14132985
- Audrey Botté, Laura Payton, Damien Tran, Artificial light at night at environmental intensities disrupts daily rhythm of the oyster Crassostrea gigas, Marine Pollution Bulletin, Volume 191, 2023, 114850, ISSN 0025-326X, https://doi.org/10.1016/j.marpolbul.2023.114850.
- Simmon, R. NASA. https://earthobservatory.nasa.gov/features/MeasuringVegetation/measuring_vegetation_2.php.
- Monica Casale, Lucia Bagnasco, Paolo Giordani, Mauro Giorgio Mariotti, Paola Malaspina, NIR spectroscopy as a tool for discriminating between lichens exposed to air pollution, Chemosphere, Volume 134, 2015, Pages 355-360, ISSN 0045-6535, https://doi.org/10.1016/j.chemosphere.2015.03.095.

